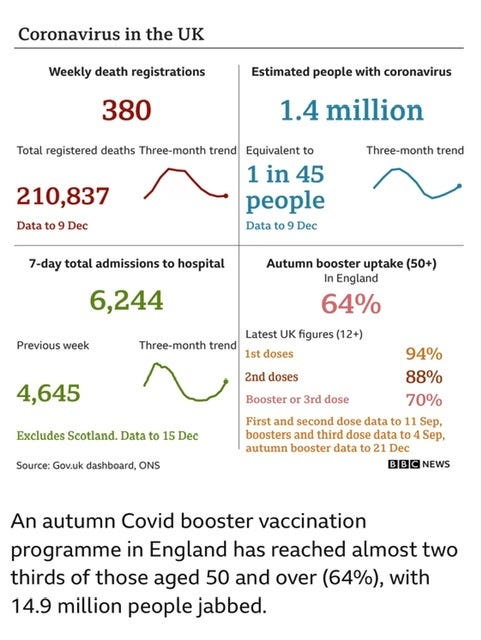
Let’s start with a quick catch up on COVID around the world as the XBB family takes over the reins. I have no need to resort to, the perhaps less than fascinating, virology, or more than a passing reference to the COVID alphabet soup this week, so bear with me. In the UK, which has pretty good uptake of their version of the revamped autumn boosters, at 64% of population, things aren’t going all that well. The National Health Service epidemiologists estimate that 1.4 million Brits currently have active COVID or 1 in 45 people. The hospitalization rate has also increased dramatically in the last week, likely an effect of holiday gatherings, with the usual uninvited guests. The table below summarizes the situation.
This approximately 30% increase in hospitalizations was what we hoped we would not be seeing at this point, as the new more immunity evasive variants take over. Singapore got through its XBB wave with massive infections, but minimal impact on hospitalizations and deaths. Different population, different vaccination rates and prior variant exposure history—maybe it’s the bangers and mash, the warm beer, or the plum pudding. You might ask why the Europeans are using a different booster than we are? It’s all science, so why the difference? The answer is that different expert individuals can look at the same incomplete set of data and arrive at different conclusions. Perhaps down the road sufficient data will allow us to decide if either approach was superior, or if it didn’t matter at all.
The WHO is still on China’s case to come clean about the reality of what’s transpiring there, but of course we will never know the truth. The best we may do are epidemiological models, based on some well established facts and extrapolated to the Chinese population. This week the UK modeling group Airfinity increased their estimate of current Chinese daily COVID related deaths to 9,000—that was a doubling of their prior estimate, and they project a potential peak in late January at 25,000 deaths per day, given the massive spread potential of Chinese New Year celebrations. It’s going to be hard to hide that—but I have faith in the CCP. Japan reached a milestone last week, in the Pandemic which is over, and recorded 415 deaths in one day. If your counting, that certainly eclipses the steady death rate of about 400 per day in the US, which has a population 2.6 times as large.
The US is beginning mandatory testing of arriving Chinese nationals, assuming they come by air and not via the Rio Grande. We will require a negative COVID test within 48 hours of departure. There are also rumors that the US will begin testing the waste water of arriving Chinese planes. Beyond the ignominious, Xenophobic and Racist implications, testing the waste water for novel variants makes great sense. There is a definite, unquantifiable risk of a serious novel variant arising as the 1.4 billion Chinese become infected with COVID. The testing of individual arrivals for COVID, even if there was an established plan for isolation (which there is not) is predicted by epidemiological models to have a very minimal impact on US disease levels. Testing either the waste water or individuals for the presence of a novel and possibly dangerous variant would be logical if a coherent plan for quarantine, pending the results of sequencing, was in place. The Chinese government just announced that they will retaliate for these terrible racist plans of the US, Italy and several other countries, by imposing renewed testing and quarantine requirements on foreign arrivals. They should by all means; the Chinese right now have more to fear from the XBB variants dominating the viral landscape in the US than we do from the BA.5 derivatives ripping through China. The variants surging in the great Chinese cities, and quickly to move throughout the entire country are all—been here, done that—as far as we are concerned. XBB variants will be the next wave to visit China.
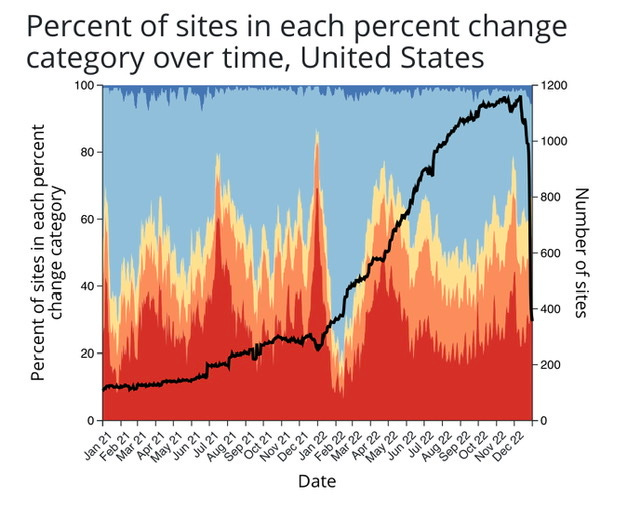
I want to quickly look back to a CDC graph from last week, updated again on Friday. This is the graphic of all the waste water COVID surveillance in the US. Take a look at the black line, it represents the number of sites which are actively reporting COVID RNA quantities. The previous week showed a precipitous decline, this week the number of sites actively surveilling for COVID fell off a cliff. You might be tempted to say, “Well the holiday just prevented them from reporting”. Perhaps, but we have not seen anything like this with past national holidays. I think a more realistic interpretation would be the combination of a movement to pretend the Pandemic is over, coupled with the end of yearly funding for various local and state programs. The tiny dark blue at the top graph are the sites where COVID is declining rapidly. The red of course represents the number of sites reporting rapid increase.
Here at home in San Miguel County, where the state of Colorado is still gathering data, last week we had one of the highest waste water COVID levels ever recorded—surpassing even the previous January 2022 peak during The Genuine Only Original Omicron (Fans of NYC Ray’s Pizza will understand).
Back in September I discussed the unfolding RSV epidemic, and its crushing effect in the pediatric hospital and outpatient system. The following graph from the Colorado Department of Public Health shows that this has passed now, with the peak occurring at the beginning of November. Take note of how insignificant pediatric COVID hospitalizations were at 1.4 per 100,000 compared to the peak of RSV at about 50 per 100,000. An effective, safe, pediatric RSV vaccine will be coming in the future, I have to wonder if it will be pushed with the same high level of governmental messaging as the Pediatric COVID vaccine.
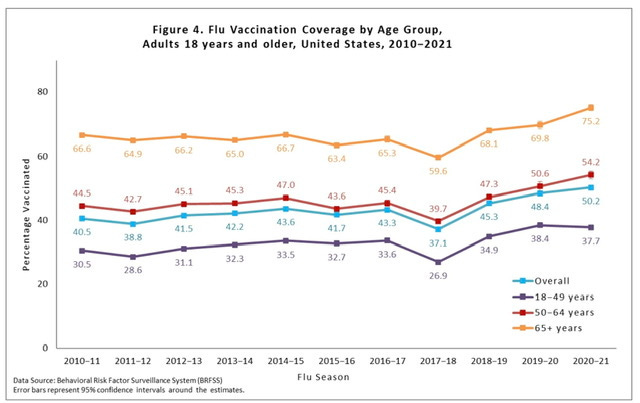
Influenza in Colorado appears to have peaked and plateaued, and a similar pattern is seen for the country as a whole, but later winter surges can not be ruled out. An interesting phenomena in my county is that since the start of the Pandemic the number of Influenza vaccines given every year has increased by an order of magnitude from the pre-pandemic baseline. That is an astonishing increase, but we are certainly an outlier. The national data shown below, by age group and only through 2020-2021, shows a modest increase of about 7% , but maybe as high as 10% for the older age group. If that is a behavioral change which carries forward post Pandemic, it may be a tiny silver lining in the COVID clouded sky.
The final point today regards Paxlovid, the antiviral I have covered previously. The initial randomized trial leading to the drug’s EUA showed an 89% efficacy in preventing COVID related hospitalization in unvaccinated high-risk outpatients. Objections were raised later on that we had no idea whether it was effective in vaccinated and boosted people. The largest study to date, looking at a total of 54,000 patients, over the age of 50, 90% of them with 3 or more vaccine doses, was published in the Annals of Internal Medicine in December.
https://www.acpjournals.org/doi/10.7326/M22-2141?utm_source=TFA&utm_campaign=1222&utm_content=TFA202212&cmp=1&utm_medium=email
While the risk of hospitalization or death for this highly vaccinated group overall was low at 1%, the Paxlovid treated patients had an adjusted risk ratio for hospitalization of 0.60, and risk ratio for death of 0.29. This was not a randomized trial but a look back at the real world results of treating patients. The Paxlovid treated group was older, and had more co-morbidities than the non-treated group, and therefore if NOT treated should have had a substantially higher hospitalization and death rate. Instead with treatment the death rate was reduced by about two thirds. Not bad for taking for 5 days of pills which cost you nothing. Even if you are vaccinated and boosted but over 65-70, or with significant co-morbidities, your risk if untreated is guaranteed to be higher than 1%. As we have seen in a previous post, the alternative antiviral Molnupiravir has not demonstrated this important advantage, and monoclonal antibodies are no longer an option. My editor is complaining that now I’m thrashing a deceased equine—perhaps so but it seems important to remind people at higher risk of the importance of early treatment.
Don’t forget to share this important piece of Literature with your friends and colleagues. Although the subscription is free, the IRS continues to lower my income tax rate by .01% for every new subscriber. They also monitor the like button at the top of the page and will certainly lower your tax bill for every swipe there. Feel free to share your thoughts on this post.


Yes the waste water does account for influx of visitors. The SARS2-RNA is measured as a concentration of copies/Liter. The volume of waste water to the plant is proportional to the number of people producing waste water. Early on we correlated waste plant water flow volumes with data from the County Tourism office showing the short term changes in population.
Does the wastewater data for San Miguel County account for the influx of visitors? Thanks